
| {"title": "Usage Metrics overview", "url": "https://support.expel.io/hc/en-us/articles/13511503596179-Usage-Metrics-overview", "date": "2023-01-30T17:25:04Z", "contents": "When your organization purchased Workbench, a certain number of attack\nsurfaces, or endpoints, were purchased. These endpoints are all the devices,\nusers, and other places threats can come from in your environment. In\nWorkbench you can see how many endpoints you're actually using in your\nenvironment.\n\n#### In this article\n\n * Viewing the overall counts\n\n * Viewing specific device counts\n\n## Viewing the overall counts\n\nTo see the total counts for your environment, click Settings > Counts.\n\n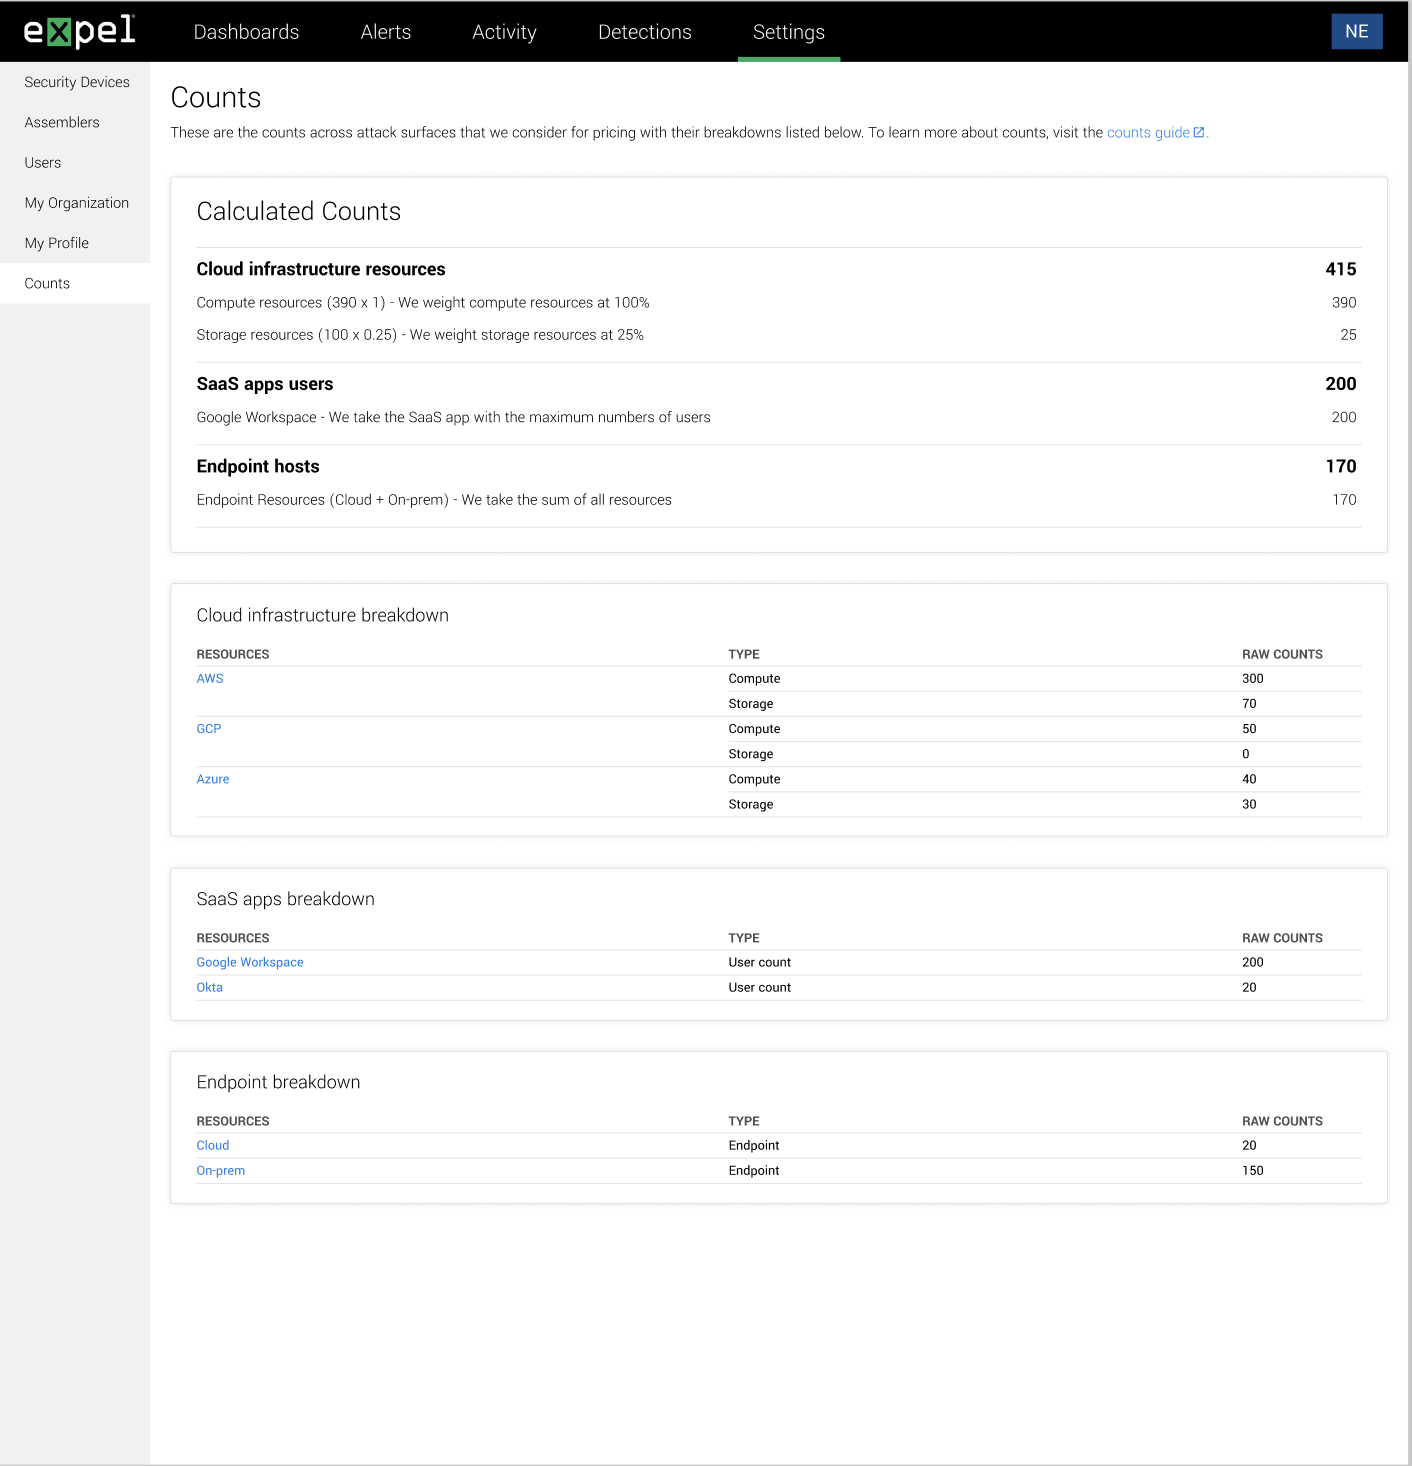\n\nOn this screen, you see:\n\n * **Calculated counts** : these are the categories and the general numbers for each area listed.\n\n * **Counts detail area** : these are the more detailed counts for the endpoints listed above.\n\nFor what the specific counts are and what they mean, go to What's counted in\nyour Expel usage\n\n## Viewing specific device counts\n\nYou can also view the counts for a specific device. This view also shows you\nthe inventory for the selected device.\n\nTo see the specific device counts, click Settings > Counts > locate the device\nto view > down arrow > View details > Counts.\n\n\n\nWhat you specifically see listed varies, based on the type of selected device.\nTo read an explanation of what you're seeing, expand Count explanations.\n\n"} |