
| {"title": "GitHub self-hosted (on-prem) setup for Workbench", "url": "https://support.expel.io/hc/en-us/articles/14049611141779-GitHub-self-hosted-on-prem-setup-for-Workbench", "date": "2023-02-16T18:36:02Z", "contents": "This article explains how to connect GitHub to Workbench.\n\n#### In this article\n\n * Before you start\n\n * Step 1: Install the self-hosted GitHub App\n\n * Step 2: Configure the technology in Workbench\n\n## Before you start\n\nYou must have:\n\n * A GitHub Enterprise account license. For more information, see GitHub products.\n\n### Note\n\nThis procedure is specifically for self-hosted GitHub deployments. For cloud-\nhosted, use the GitHub cloud-hosted Workbench setup guide.\n\n## Step 1: Install the self-hosted GitHub App\n\nWorkbench uses a GitHub App as part of the onboarding process. During\ninstallation, the Expel GitHub App receives the following organization-level\nprivileges:\n\n * Members: Read+Write\n\n * Administration: Read-only\n\n### Note\n\nGitHub doesn't log user identities, making it difficult to track suspicious\nactivity at the user level. To solve this problem, Expel uses Write\nPermissions to map GitHub data to a user's identity.\n\n 1. Use the Create a GitHub App instructions to create a custom application in the organization you want monitored. Fill in the required fields like this:\n\n * GitHub app name: ExpelGitHubIntegration\n\n * https://github.com/apps/expelgithubintegration\n\n * Permissions:\n\n * Members: Read+Write\n\n * Administration: Read-Only\n\n * Leave all other fields blank.\n\n 2. Navigate to the organization's Apps Settings page. Example URL: https://github.*****/organizations/*****/settings/apps/ExpelGitHubIntegration.\n\n 3. Write down the App ID.\n\n 4. Use the Authenticating with GitHub Apps instructions to generate a private key and store it for later use. This is your PEM key and you need it in the next section.\n\n * ### Note\n\nIf you have multiple organizations, create a separate Security Device in\nWorkbench for each organization.\n\n 5. If you are using an Expel Assembler within your network, use the Managing allowed IP addresses for a GitHub App instructions to add the assembler's internal IP to the allow list. Otherwise, add the Expel egress IPs to the allow list:\n\n * 34.75.13.114\n\n * 34.75.152.7\n\n * 35.243.190.98\n\n * 104.196.158.205\n\n * 34.75.81.28\n\n * 34.75.210.18\n\n## Step 2: Configure the technology in Workbench\n\nNow that we have the correct access configured and noted the credentials, we\ncan integrate your tech with Workbench.\n\n### Note\n\nExpel secures all login information our SOC analysts need about your devices\nin a MFA password product. Access to this login information is protected using\nour internal MFA processes. To learn more about the IP addresses all Expel\ntraffic comes from, go here.\n\n 1. In a new browser tab, login to https://workbench.expel.io/settings/security-devices?setupIntegration=github.\n\n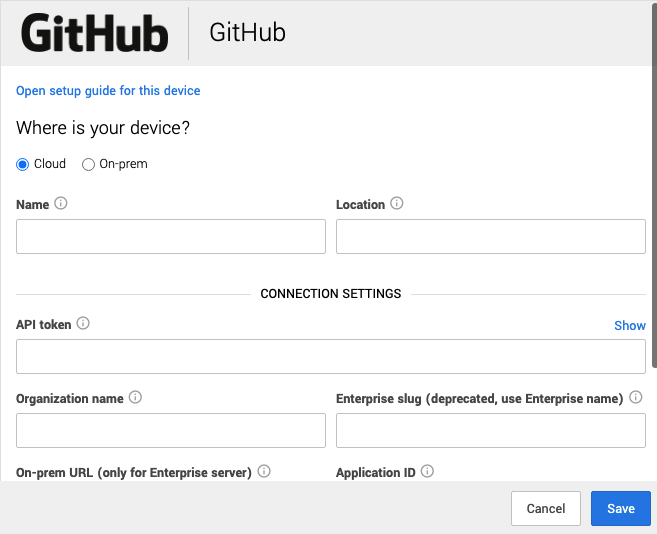\n\n 2. For Where is your device? select:\n\n 1. If you decided to allowlist the Expel egress IPs, select Cloud.\n\n 2. If you are using an Assembler, select On-prem.\n\n 3. For Assembler select the Assembler from the list. N/A for Cloud.\n\n 4. Complete these fields using the credentials and information from Step 1.\n\n * For Name type the name of your GitHub organization.\n\n * For Location type Cloud.\n\n * For Organization name, type the name of your GitHub organization.\n\n * For Enterprise slug type the Enterprise name.\n\n * For the Application installation ID type the installation ID from Step 1.\n\n * For Application ID type the application ID from Step 1.\n\n * For Application Private PEM, copy and paste the PEM file contents from Step 1.\n\n 5. Click Save.\n\nYou can see if the device is healthy on the Security Devices page. It may take\na few minutes to see the device listed as healthy.\n\nTo check if alerts are coming through, navigate to the Alerts Analysis page.\nScroll to the device you want to check and click View alerts. Switch to grid\nview, then check the list for device alerts. It can take 36 to 72 hours for\nalerts to appear after setup, as we tune your device.\n\n### Tip\n\nThis article was accurate at the time of writing, but changes happen. If you\nfind the instructions are outdated, leave a description in the comment field\nbelow and let us know!\n\n"} |