
image
imagewidth (px) 1.3k
1.8k
|
|---|
Non-contact sugar estimation with hyperpsectral data

Access the data
You can now access this dataset via the Living Optics Cloud Portal
Motivation
Precision viticulture and adaptive harvesting
Wine quality is heavily dependent on the grape maturity at harvest and can decline by 10% in a week. To maximise quality, the harvest time of grape berries should be optimised for
- sugar levels, usually measured as total soluble solids (TSS) or Brix
- berry acidity, often expressed as pH and titratable acidity (TA);
- concentrations of the main organic acids in the berry, such as tartaric and malic acid; and for red varieties anthocyanin and
- total phenol concentrations.
These values are typically analysed using wet chemistry procedures on periodically sampled berries one to three weeks before harvest. These analytical methods are destructive, require time-consuming berry sampling, as well as sample preparation in most instances.
Why Hyperspectral imaging?
Hyperspectral imaging offers a method for non-destructive, high-throughput testing of grape berries. These measurements require less specialised labour, no reagents and can have relatively low cost per analysis. Hyperspectral imagers, combined with statistical modelling techniques, have been shown to accurately predict grape parameters in a non-destructive manner for table and wine grapes using methods such as partial least squares regression analysis (PLSA).
Living Optics are developing pioneering hyperspectral cameras for the mass market. Our mission is to enable the next generation of computer vision through Spatial Spectral Information.

This is a notebook showing how hyperspectral data, collected with the Living Optics camera, can be paired with statistical analysis to train a regressor for extracting grape parameters.
Method
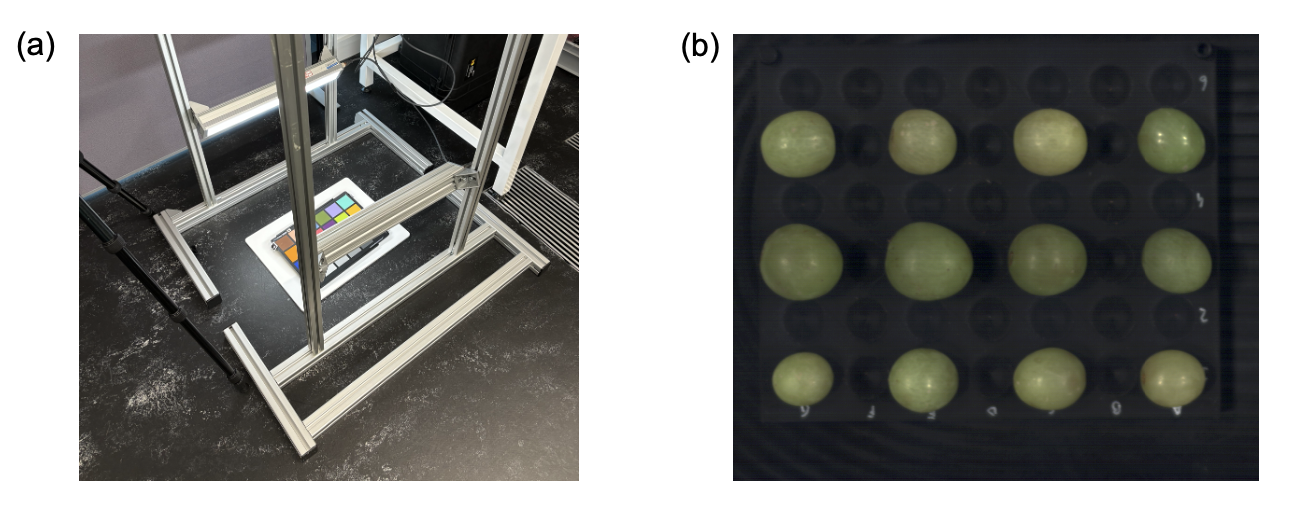
Individual grapes were extracted from six boxes of white table grapes (Agrimessina, Italy). These 300 individual table grapes were imaged using a custom lighting rig. The Living Optics camera was mounted on a downwards facing tripod directly above the sample to achieve a (45/0◦) imaging geometry. Twelve grape samples were placed on a black PLA tray per imaging round shown in Figure 9(b). Additionally, a white reference was collected by imaging a sheet of Tyvek in place of the tray. Using an objective lens focal length of 18 mm, approximately 150 sampling points were obtained per grape on average.
After imaging, 3-4 drops of juice from each grape ( 0.2ml) were extracted and measured with a handheld BRIX refractometer (AS-Q6, Aicevoos, China). The error of the instrument is given as ±0.2 ◦Bx.
Dataset contains
- 🍇 300 processed diffuse reflectance spectra of white grapes collected with the Living Optics camera
- 🧑🔬 Paired sugar content values for each grape

Citation
Raw data is available by request
- Downloads last month
- 80