
Create README.md
#2
by
TMVishnu
- opened
- .gitattributes +58 -2
- README.md +56 -126
- dataset_infos.json +0 -18
- data/edges.npz → edges.npz +0 -0
- data/features.npy → features.npy +0 -0
- final_embeddings.pt +3 -0
- loaded_data.pkl +3 -0
- processed_df.pkl +3 -0
- data/watch_gnn_data.pt → watch_gnn_data.pt +0 -0
.gitattributes
CHANGED
|
@@ -1,3 +1,59 @@
|
|
| 1 |
-
*.
|
| 2 |
-
*.
|
|
|
|
|
|
|
|
|
|
|
|
|
|
|
|
|
|
|
|
|
|
|
|
|
|
|
|
|
|
|
|
|
|
|
|
|
|
|
|
| 3 |
*.npy filter=lfs diff=lfs merge=lfs -text
|
|
|
|
|
|
|
|
|
|
|
|
|
|
|
|
|
|
|
|
|
|
|
|
|
|
|
|
|
|
|
|
|
|
|
|
|
|
|
|
|
|
|
|
|
|
|
|
|
|
|
|
|
|
|
|
|
|
|
|
|
|
|
|
|
|
|
|
|
|
|
|
|
|
|
|
|
|
|
|
|
|
|
|
|
|
|
|
|
|
|
|
|
|
|
|
|
|
|
|
|
|
|
|
|
|
|
|
|
|
|
|
|
|
|
|
|
|
|
|
|
|
|
|
|
|
|
|
|
|
|
|
| 1 |
+
*.7z filter=lfs diff=lfs merge=lfs -text
|
| 2 |
+
*.arrow filter=lfs diff=lfs merge=lfs -text
|
| 3 |
+
*.bin filter=lfs diff=lfs merge=lfs -text
|
| 4 |
+
*.bz2 filter=lfs diff=lfs merge=lfs -text
|
| 5 |
+
*.ckpt filter=lfs diff=lfs merge=lfs -text
|
| 6 |
+
*.ftz filter=lfs diff=lfs merge=lfs -text
|
| 7 |
+
*.gz filter=lfs diff=lfs merge=lfs -text
|
| 8 |
+
*.h5 filter=lfs diff=lfs merge=lfs -text
|
| 9 |
+
*.joblib filter=lfs diff=lfs merge=lfs -text
|
| 10 |
+
*.lfs.* filter=lfs diff=lfs merge=lfs -text
|
| 11 |
+
*.lz4 filter=lfs diff=lfs merge=lfs -text
|
| 12 |
+
*.mds filter=lfs diff=lfs merge=lfs -text
|
| 13 |
+
*.mlmodel filter=lfs diff=lfs merge=lfs -text
|
| 14 |
+
*.model filter=lfs diff=lfs merge=lfs -text
|
| 15 |
+
*.msgpack filter=lfs diff=lfs merge=lfs -text
|
| 16 |
*.npy filter=lfs diff=lfs merge=lfs -text
|
| 17 |
+
*.npz filter=lfs diff=lfs merge=lfs -text
|
| 18 |
+
*.onnx filter=lfs diff=lfs merge=lfs -text
|
| 19 |
+
*.ot filter=lfs diff=lfs merge=lfs -text
|
| 20 |
+
*.parquet filter=lfs diff=lfs merge=lfs -text
|
| 21 |
+
*.pb filter=lfs diff=lfs merge=lfs -text
|
| 22 |
+
*.pickle filter=lfs diff=lfs merge=lfs -text
|
| 23 |
+
*.pkl filter=lfs diff=lfs merge=lfs -text
|
| 24 |
+
*.pt filter=lfs diff=lfs merge=lfs -text
|
| 25 |
+
*.pth filter=lfs diff=lfs merge=lfs -text
|
| 26 |
+
*.rar filter=lfs diff=lfs merge=lfs -text
|
| 27 |
+
*.safetensors filter=lfs diff=lfs merge=lfs -text
|
| 28 |
+
saved_model/**/* filter=lfs diff=lfs merge=lfs -text
|
| 29 |
+
*.tar.* filter=lfs diff=lfs merge=lfs -text
|
| 30 |
+
*.tar filter=lfs diff=lfs merge=lfs -text
|
| 31 |
+
*.tflite filter=lfs diff=lfs merge=lfs -text
|
| 32 |
+
*.tgz filter=lfs diff=lfs merge=lfs -text
|
| 33 |
+
*.wasm filter=lfs diff=lfs merge=lfs -text
|
| 34 |
+
*.xz filter=lfs diff=lfs merge=lfs -text
|
| 35 |
+
*.zip filter=lfs diff=lfs merge=lfs -text
|
| 36 |
+
*.zst filter=lfs diff=lfs merge=lfs -text
|
| 37 |
+
*tfevents* filter=lfs diff=lfs merge=lfs -text
|
| 38 |
+
# Audio files - uncompressed
|
| 39 |
+
*.pcm filter=lfs diff=lfs merge=lfs -text
|
| 40 |
+
*.sam filter=lfs diff=lfs merge=lfs -text
|
| 41 |
+
*.raw filter=lfs diff=lfs merge=lfs -text
|
| 42 |
+
# Audio files - compressed
|
| 43 |
+
*.aac filter=lfs diff=lfs merge=lfs -text
|
| 44 |
+
*.flac filter=lfs diff=lfs merge=lfs -text
|
| 45 |
+
*.mp3 filter=lfs diff=lfs merge=lfs -text
|
| 46 |
+
*.ogg filter=lfs diff=lfs merge=lfs -text
|
| 47 |
+
*.wav filter=lfs diff=lfs merge=lfs -text
|
| 48 |
+
# Image files - uncompressed
|
| 49 |
+
*.bmp filter=lfs diff=lfs merge=lfs -text
|
| 50 |
+
*.gif filter=lfs diff=lfs merge=lfs -text
|
| 51 |
+
*.png filter=lfs diff=lfs merge=lfs -text
|
| 52 |
+
*.tiff filter=lfs diff=lfs merge=lfs -text
|
| 53 |
+
# Image files - compressed
|
| 54 |
+
*.jpg filter=lfs diff=lfs merge=lfs -text
|
| 55 |
+
*.jpeg filter=lfs diff=lfs merge=lfs -text
|
| 56 |
+
*.webp filter=lfs diff=lfs merge=lfs -text
|
| 57 |
+
# Video files - compressed
|
| 58 |
+
*.mp4 filter=lfs diff=lfs merge=lfs -text
|
| 59 |
+
*.webm filter=lfs diff=lfs merge=lfs -text
|
README.md
CHANGED
|
@@ -10,61 +10,7 @@ size_categories:
|
|
| 10 |
|
| 11 |
# Watch Market Analysis Graph Neural Network Dataset
|
| 12 |
|
| 13 |
-
##
|
| 14 |
-
|
| 15 |
-
- Github link to the code through which this dataset was generated from: [watch-market-gnn-code](https://github.com/calicartels/watch-market-gnn-code)
|
| 16 |
-
- Link to interactive EDA that is hosted on a website : [Watch Market Analysis Report](https://incomparable-torrone-ccda90.netlify.app/)
|
| 17 |
-
|
| 18 |
-
## Table of Contents
|
| 19 |
-
[Summary](#summary)
|
| 20 |
-
[Dataset Description](#dataset-description)
|
| 21 |
-
[Technical Details](#technical-details)
|
| 22 |
-
[Exploratory Data Analysis](#exploratory-data-analysis)
|
| 23 |
-
[Ethics and Limitations](#ethics-and-limitations)
|
| 24 |
-
[Usage](#usage)
|
| 25 |
-
|
| 26 |
-
<details>
|
| 27 |
-
<summary>Detailed Table of Contents</summary>
|
| 28 |
-
|
| 29 |
-
* Summary
|
| 30 |
-
* Key Statistics
|
| 31 |
-
* Primary Use Cases
|
| 32 |
-
* Dataset Description
|
| 33 |
-
* Data Structure
|
| 34 |
-
* Features
|
| 35 |
-
* Network Properties
|
| 36 |
-
* Processing Parameters
|
| 37 |
-
* Technical Details
|
| 38 |
-
* Power Analysis
|
| 39 |
-
* Implementation Details
|
| 40 |
-
* Network Architecture
|
| 41 |
-
* Embedding Dimensions
|
| 42 |
-
* Network Parameters
|
| 43 |
-
* Condition Scoring
|
| 44 |
-
* Exploratory Data Analysis
|
| 45 |
-
* Brand Distribution
|
| 46 |
-
* Feature Correlations
|
| 47 |
-
* Market Structure Visualizations
|
| 48 |
-
* UMAP Analysis
|
| 49 |
-
* t-SNE Visualization
|
| 50 |
-
* PCA Analysis
|
| 51 |
-
* Network Visualizations
|
| 52 |
-
* Ethics and Limitations
|
| 53 |
-
* Data Collection and Privacy
|
| 54 |
-
* Known Biases
|
| 55 |
-
* Usage Guidelines
|
| 56 |
-
* License
|
| 57 |
-
* Usage
|
| 58 |
-
* Required Files
|
| 59 |
-
* Loading the Dataset
|
| 60 |
-
* Code Examples
|
| 61 |
-
|
| 62 |
-
</details>
|
| 63 |
-
|
| 64 |
-
---
|
| 65 |
-
|
| 66 |
-
|
| 67 |
-
## Summary
|
| 68 |
|
| 69 |
This dataset transforms traditional watch market data into a Graph Neural Network (GNN) structure, specifically designed to capture the complex dynamics of the pre-owned luxury watch market.
|
| 70 |
It addresses three key market characteristics that traditional recommendation systems often miss:
|
|
@@ -119,82 +65,30 @@ Key features include:
|
|
| 119 |
- Edge Generation Batch: 32 watches
|
| 120 |
- Network Architecture: Combined GCN and GAT layers with 4 attention heads
|
| 121 |
|
| 122 |
-
## Technical Details
|
| 123 |
-
|
| 124 |
-
### Power Analysis
|
| 125 |
-
Minimum sample requirements based on statistical analysis:
|
| 126 |
-
- Basic Network: 10,671 nodes (95% confidence, 3% margin)
|
| 127 |
-
- GNN Requirements: 14,400 samples (feature space dimensionality)
|
| 128 |
-
- Brand Coverage: 768 watches per brand
|
| 129 |
-
- Price Segments: 4,320 watches per segment
|
| 130 |
-
|
| 131 |
-
Current dataset (284,491 watches) exceeds requirements with:
|
| 132 |
-
- 5,000+ samples per major brand
|
| 133 |
-
- 50,000+ samples per price segment
|
| 134 |
-
- Sufficient network density
|
| 135 |
-
|
| 136 |
-
### Implementation Details
|
| 137 |
-
|
| 138 |
-
#### Network Architecture
|
| 139 |
-
- 3 GNN layers with residual connections
|
| 140 |
-
- 64 hidden channels
|
| 141 |
-
- 20% dropout rate
|
| 142 |
-
- 4 attention heads
|
| 143 |
-
- Learning rate: 0.001
|
| 144 |
-
|
| 145 |
-
#### Embedding Dimensions
|
| 146 |
-
- Brand: 128
|
| 147 |
-
- Material: 64
|
| 148 |
-
- Movement: 64
|
| 149 |
-
- Temporal: 32
|
| 150 |
-
|
| 151 |
-
#### Network Parameters
|
| 152 |
-
- Connections per watch: 3-5
|
| 153 |
-
- Similarity threshold: 70%
|
| 154 |
-
- Batch size: 50 watches
|
| 155 |
-
- Processing window: 1000 watches
|
| 156 |
-
|
| 157 |
-
#### Condition Scoring
|
| 158 |
-
- New: 1.0
|
| 159 |
-
- Unworn: 0.95
|
| 160 |
-
- Very Good: 0.8
|
| 161 |
-
- Good: 0.7
|
| 162 |
-
- Fair: 0.5
|
| 163 |
|
| 164 |
## Exploratory Data Analysis
|
| 165 |
|
| 166 |
-
**NOTE:**
|
| 167 |
-
Only certain selected visualizations have been mentioned here, to see all the visualizations that have been explored in high-quality interactive graphs, please visit this site:
|
| 168 |
-
[Watch Market Analysis Report](https://incomparable-torrone-ccda90.netlify.app/)
|
| 169 |
-
|
| 170 |
### Brand Distribution
|
| 171 |
-
|
| 172 |
-
|
| 173 |
-
|
| 174 |
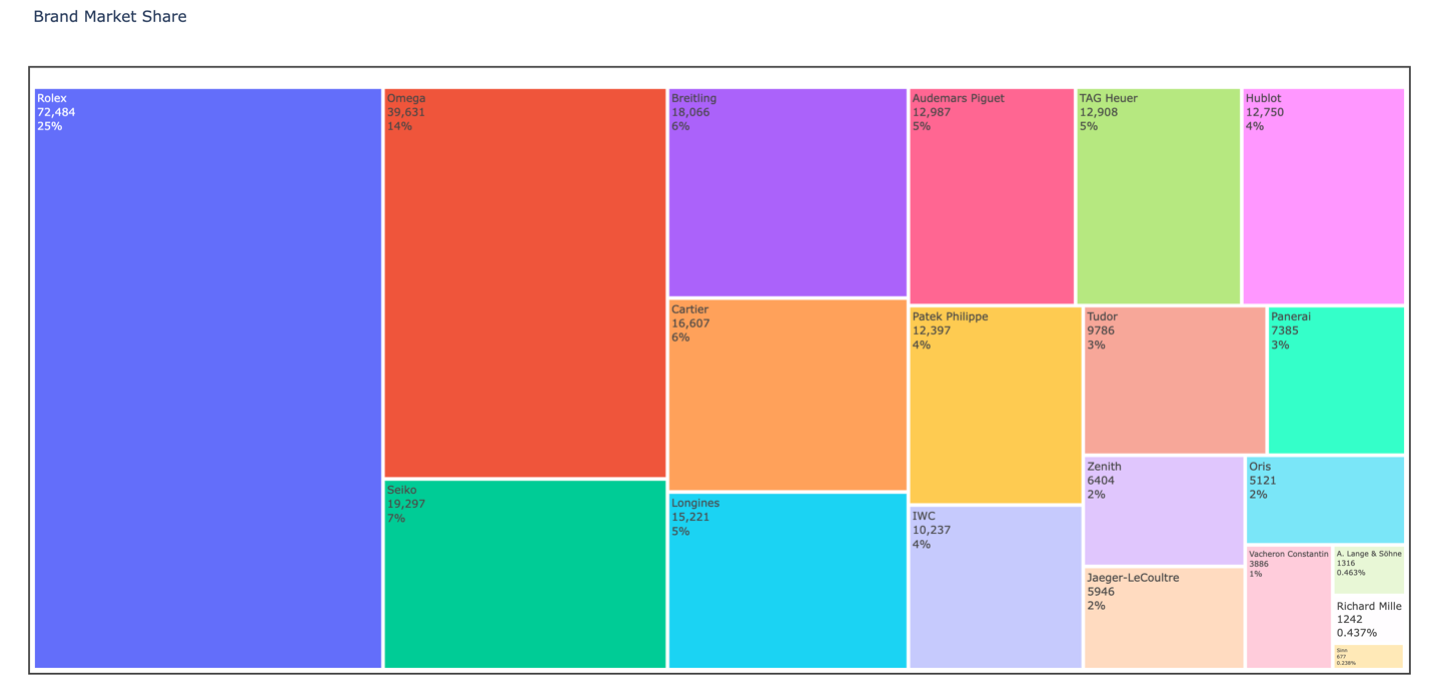
The treemap visualization provides a hierarchical view of market presence:
|
| 175 |
- Rolex dominates with the highest representation, reflecting its market leadership
|
| 176 |
-
- Omega and Seiko follow as major players, indicating
|
| 177 |
- Distribution reveals clear tiers in the luxury watch market
|
| 178 |
- Brand representation correlates with market positioning and availability
|
| 179 |
|
|
|
|
| 180 |
|
| 181 |
### Feature Correlations
|
| 182 |
-
|
| 183 |
-
|
| 184 |
-
|
| 185 |
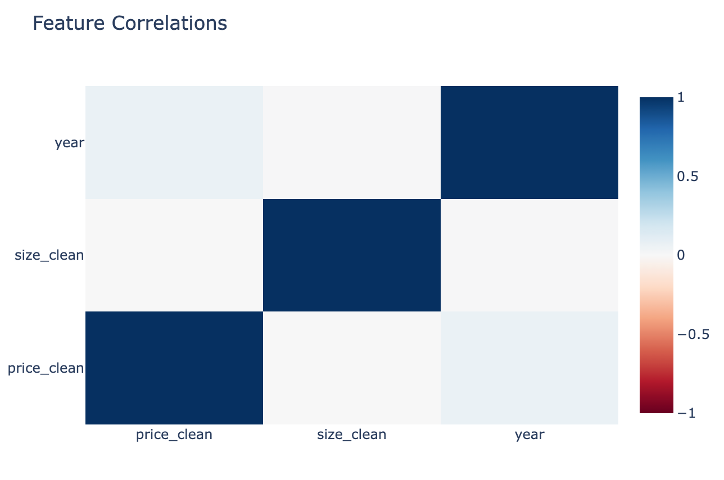
The correlation matrix reveals important market dynamics:
|
| 186 |
- **Size vs. Year**: Positive correlation indicating a trend toward larger case sizes in modern watches
|
| 187 |
- **Price vs. Size**: Moderate correlation showing larger watches generally command higher prices
|
| 188 |
- **Price vs. Year**: Notably low correlation, demonstrating that vintage watches maintain value
|
| 189 |
- Each feature contributes unique information, validated by the lack of strong correlations across all variables
|
| 190 |
|
|
|
|
| 191 |
|
| 192 |
### Market Structure Visualizations
|
| 193 |
|
| 194 |
#### UMAP Analysis
|
| 195 |
-
|
| 196 |
-
|
| 197 |
-
|
| 198 |
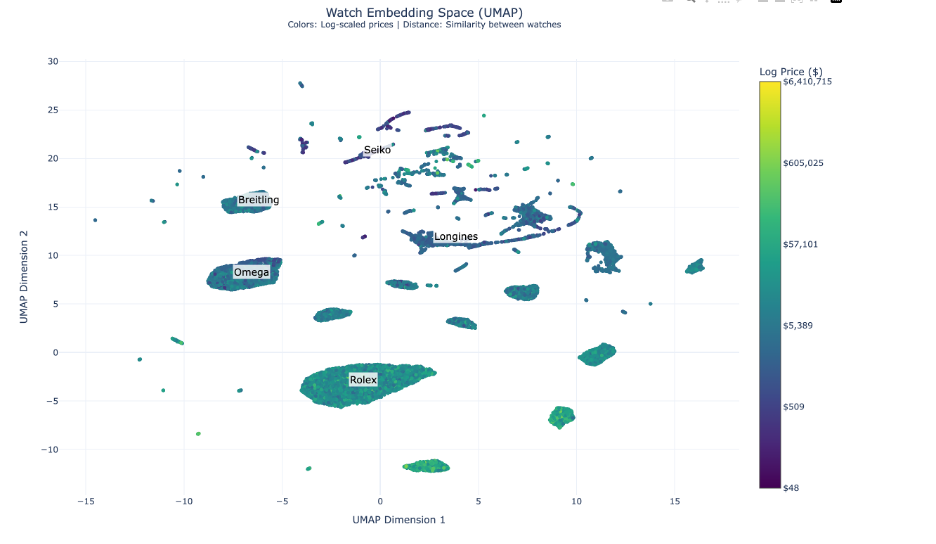
The UMAP visualization unveils complex market positioning dynamics:
|
| 199 |
- Rolex maintains a dominant central position around coordinates (0, -5), showing unparalleled brand cohesion
|
| 200 |
- Omega and Breitling cluster in the left segment, indicating strategic market alignment
|
|
@@ -202,11 +96,9 @@ The UMAP visualization unveils complex market positioning dynamics:
|
|
| 202 |
- Premium timepieces (yellower/greener hues) show tighter clustering, suggesting standardized luxury attributes
|
| 203 |
- Smaller, specialized clusters indicate distinct horological collections and style categories
|
| 204 |
|
|
|
|
| 205 |
|
| 206 |
#### t-SNE Visualization
|
| 207 |
-
|
| 208 |
-
|
| 209 |
-
|
| 210 |
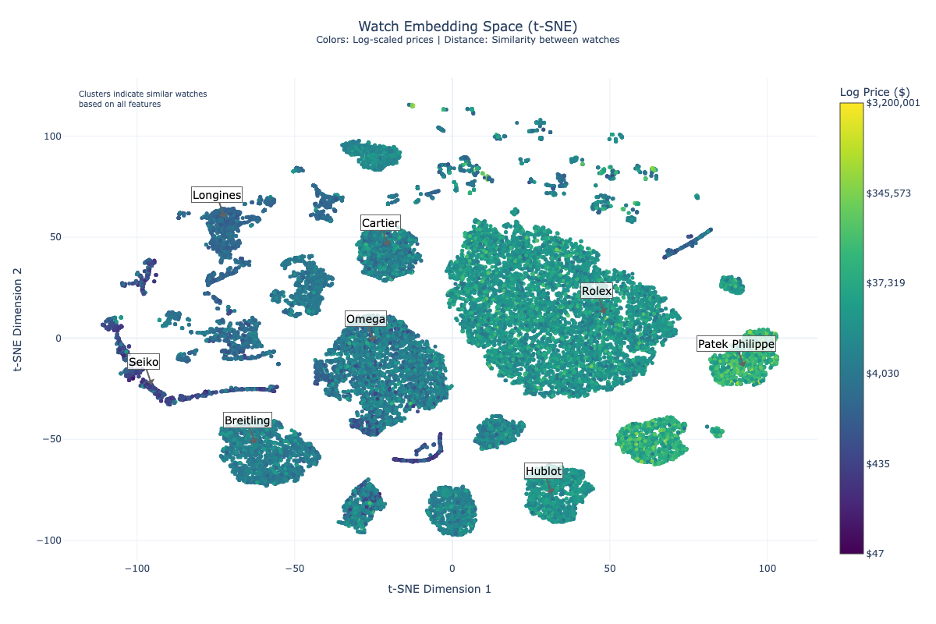
T-SNE analysis reveals clear market stratification with logarithmic pricing from $50 to $3.2M:
|
| 211 |
- **Entry-Level Segment ($50-$4,000)**
|
| 212 |
- Anchored by Seiko in the left segment
|
|
@@ -217,13 +109,12 @@ T-SNE analysis reveals clear market stratification with logarithmic pricing from
|
|
| 217 |
- Cartier demonstrates strategic positioning between luxury and mid-range
|
| 218 |
- **Ultra-Luxury Segment ($35,000-$3.2M)**
|
| 219 |
- Dominated by Patek Philippe and Audemars Piguet
|
| 220 |
-
- Clear separation in
|
| 221 |
- Strong brand clustering indicating market alignment
|
| 222 |
|
| 223 |
-
|
| 224 |
-
|
| 225 |
-
|
| 226 |
|
|
|
|
| 227 |
Principal Component Analysis provides robust market insights with 56.6% total explained variance:
|
| 228 |
- **First Principal Component (31.3%)**
|
| 229 |
- Predominantly captures price dynamics
|
|
@@ -234,33 +125,28 @@ Principal Component Analysis provides robust market insights with 56.6% total ex
|
|
| 234 |
- **Brand Trajectory**
|
| 235 |
- Natural progression from Seiko through Longines, Breitling, and Omega
|
| 236 |
- Culminates in Rolex and Patek Philippe
|
| 237 |
-
- Diagonal trend line serves as
|
| 238 |
- **Market Implications**
|
| 239 |
- Successful brands occupy optimal positions along both dimensions
|
| 240 |
- Clear differentiation between adjacent competitors
|
| 241 |
- Evidence of strategic market positioning
|
| 242 |
|
|
|
|
| 243 |
|
| 244 |
#### Network Visualizations
|
| 245 |
|
| 246 |
-
|
| 247 |
**Force-Directed Graph**
|
| 248 |
-
|
| 249 |
-
|
| 250 |
-
|
| 251 |
The force-directed layout reveals natural market clustering:
|
| 252 |
- Richard Mille's peripheral positioning highlights ultra-luxury strategy
|
| 253 |
- Dense central clustering shows mainstream luxury brand interconnectivity
|
| 254 |
- Edge patterns reveal shared market characteristics
|
| 255 |
- Node proximity indicates competitive positioning
|
| 256 |
|
|
|
|
| 257 |
|
| 258 |
**Starburst Visualization**
|
| 259 |
-
|
| 260 |
-
|
| 261 |
-
|
| 262 |
Radial architecture provides a hierarchical market perspective:
|
| 263 |
-
- Central node represents
|
| 264 |
- Green nodes show brand territories with strategic spacing
|
| 265 |
- Blue peripheral nodes indicate individual timepieces
|
| 266 |
- Node density reveals:
|
|
@@ -269,6 +155,8 @@ Radial architecture provides a hierarchical market perspective:
|
|
| 269 |
- Segment diversification
|
| 270 |
- Balanced spacing between brand nodes indicates market segmentation
|
| 271 |
|
|
|
|
|
|
|
| 272 |
|
| 273 |
## Ethics and Limitations
|
| 274 |
|
|
@@ -339,6 +227,48 @@ While requiring:
|
|
| 339 |
- Preserve attributions
|
| 340 |
|
| 341 |
|
|
|
|
|
|
|
|
|
|
|
|
|
|
|
|
|
|
|
|
|
|
|
|
|
|
|
|
|
|
|
|
|
|
|
|
|
|
|
|
|
|
|
|
|
|
|
|
|
|
|
|
|
|
|
|
|
|
|
|
|
|
|
|
|
|
|
|
|
|
|
|
|
|
|
|
|
|
|
|
|
|
|
|
|
|
|
|
|
|
|
|
|
|
|
|
|
|
|
|
|
|
|
|
|
|
|
|
|
|
|
|
|
|
|
|
|
|
|
|
|
|
|
|
|
|
|
| 342 |
## Usage
|
| 343 |
|
| 344 |
### Required Files
|
|
|
|
| 10 |
|
| 11 |
# Watch Market Analysis Graph Neural Network Dataset
|
| 12 |
|
| 13 |
+
## Executive Summary
|
|
|
|
|
|
|
|
|
|
|
|
|
|
|
|
|
|
|
|
|
|
|
|
|
|
|
|
|
|
|
|
|
|
|
|
|
|
|
|
|
|
|
|
|
|
|
|
|
|
|
|
|
|
|
|
|
|
|
|
|
|
|
|
|
|
|
|
|
|
|
|
|
|
|
|
|
|
|
|
|
|
|
|
|
|
|
|
|
|
|
|
|
|
|
|
|
|
|
|
|
|
|
|
|
|
|
|
|
|
|
|
|
|
|
|
|
|
|
|
|
|
|
|
|
|
|
|
|
|
|
|
|
|
|
|
|
|
|
|
|
|
|
|
|
|
|
|
|
|
|
|
|
|
|
|
|
|
|
|
|
|
|
| 14 |
|
| 15 |
This dataset transforms traditional watch market data into a Graph Neural Network (GNN) structure, specifically designed to capture the complex dynamics of the pre-owned luxury watch market.
|
| 16 |
It addresses three key market characteristics that traditional recommendation systems often miss:
|
|
|
|
| 65 |
- Edge Generation Batch: 32 watches
|
| 66 |
- Network Architecture: Combined GCN and GAT layers with 4 attention heads
|
| 67 |
|
|
|
|
|
|
|
|
|
|
|
|
|
|
|
|
|
|
|
|
|
|
|
|
|
|
|
|
|
|
|
|
|
|
|
|
|
|
|
|
|
|
|
|
|
|
|
|
|
|
|
|
|
|
|
|
|
|
|
|
|
|
|
|
|
|
|
|
|
|
|
|
|
|
|
|
|
|
|
|
|
|
|
|
|
|
|
|
|
|
|
|
|
|
|
|
|
|
|
|
|
|
|
|
|
|
|
|
|
|
|
|
|
|
|
|
|
|
|
|
|
|
|
|
| 68 |
|
| 69 |
## Exploratory Data Analysis
|
| 70 |
|
|
|
|
|
|
|
|
|
|
|
|
|
| 71 |
### Brand Distribution
|
|
|
|
|
|
|
|
|
|
| 72 |
The treemap visualization provides a hierarchical view of market presence:
|
| 73 |
- Rolex dominates with the highest representation, reflecting its market leadership
|
| 74 |
+
- Omega and Seiko follow as major players, indicating strong market presence
|
| 75 |
- Distribution reveals clear tiers in the luxury watch market
|
| 76 |
- Brand representation correlates with market positioning and availability
|
| 77 |
|
| 78 |
+
[Treemap Image]
|
| 79 |
|
| 80 |
### Feature Correlations
|
|
|
|
|
|
|
|
|
|
| 81 |
The correlation matrix reveals important market dynamics:
|
| 82 |
- **Size vs. Year**: Positive correlation indicating a trend toward larger case sizes in modern watches
|
| 83 |
- **Price vs. Size**: Moderate correlation showing larger watches generally command higher prices
|
| 84 |
- **Price vs. Year**: Notably low correlation, demonstrating that vintage watches maintain value
|
| 85 |
- Each feature contributes unique information, validated by the lack of strong correlations across all variables
|
| 86 |
|
| 87 |
+
[Correlation Matrix Image]
|
| 88 |
|
| 89 |
### Market Structure Visualizations
|
| 90 |
|
| 91 |
#### UMAP Analysis
|
|
|
|
|
|
|
|
|
|
| 92 |
The UMAP visualization unveils complex market positioning dynamics:
|
| 93 |
- Rolex maintains a dominant central position around coordinates (0, -5), showing unparalleled brand cohesion
|
| 94 |
- Omega and Breitling cluster in the left segment, indicating strategic market alignment
|
|
|
|
| 96 |
- Premium timepieces (yellower/greener hues) show tighter clustering, suggesting standardized luxury attributes
|
| 97 |
- Smaller, specialized clusters indicate distinct horological collections and style categories
|
| 98 |
|
| 99 |
+
[UMAP Image]
|
| 100 |
|
| 101 |
#### t-SNE Visualization
|
|
|
|
|
|
|
|
|
|
| 102 |
T-SNE analysis reveals clear market stratification with logarithmic pricing from $50 to $3.2M:
|
| 103 |
- **Entry-Level Segment ($50-$4,000)**
|
| 104 |
- Anchored by Seiko in the left segment
|
|
|
|
| 109 |
- Cartier demonstrates strategic positioning between luxury and mid-range
|
| 110 |
- **Ultra-Luxury Segment ($35,000-$3.2M)**
|
| 111 |
- Dominated by Patek Philippe and Audemars Piguet
|
| 112 |
+
- Clear separation in right segment
|
| 113 |
- Strong brand clustering indicating market alignment
|
| 114 |
|
| 115 |
+
[t-SNE Image]
|
|
|
|
|
|
|
| 116 |
|
| 117 |
+
#### PCA Analysis
|
| 118 |
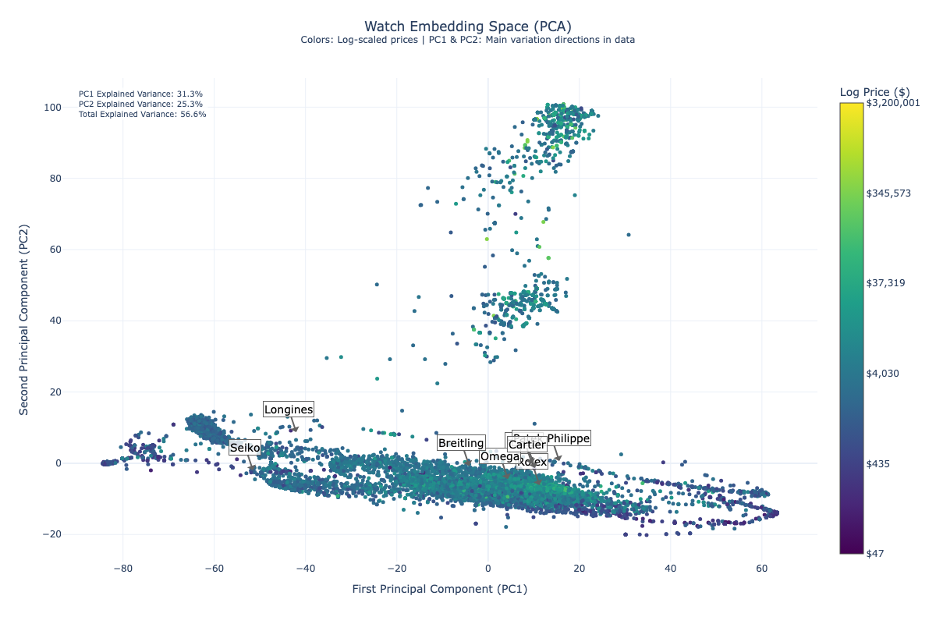
Principal Component Analysis provides robust market insights with 56.6% total explained variance:
|
| 119 |
- **First Principal Component (31.3%)**
|
| 120 |
- Predominantly captures price dynamics
|
|
|
|
| 125 |
- **Brand Trajectory**
|
| 126 |
- Natural progression from Seiko through Longines, Breitling, and Omega
|
| 127 |
- Culminates in Rolex and Patek Philippe
|
| 128 |
+
- Diagonal trend line serves as market positioning indicator
|
| 129 |
- **Market Implications**
|
| 130 |
- Successful brands occupy optimal positions along both dimensions
|
| 131 |
- Clear differentiation between adjacent competitors
|
| 132 |
- Evidence of strategic market positioning
|
| 133 |
|
| 134 |
+
[PCA Image]
|
| 135 |
|
| 136 |
#### Network Visualizations
|
| 137 |
|
|
|
|
| 138 |
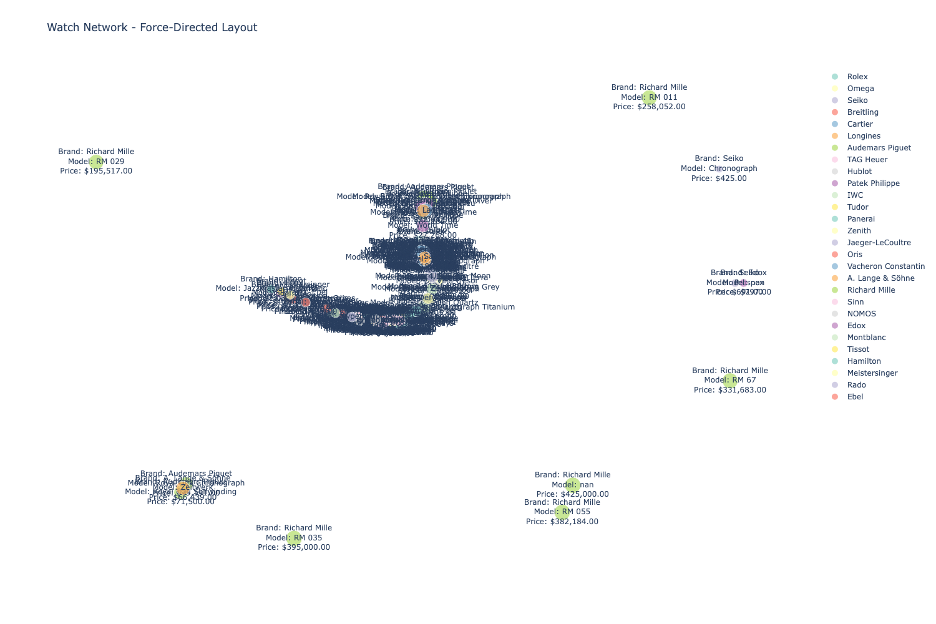
**Force-Directed Graph**
|
|
|
|
|
|
|
|
|
|
| 139 |
The force-directed layout reveals natural market clustering:
|
| 140 |
- Richard Mille's peripheral positioning highlights ultra-luxury strategy
|
| 141 |
- Dense central clustering shows mainstream luxury brand interconnectivity
|
| 142 |
- Edge patterns reveal shared market characteristics
|
| 143 |
- Node proximity indicates competitive positioning
|
| 144 |
|
| 145 |
+
[Force-Directed Graph Image]
|
| 146 |
|
| 147 |
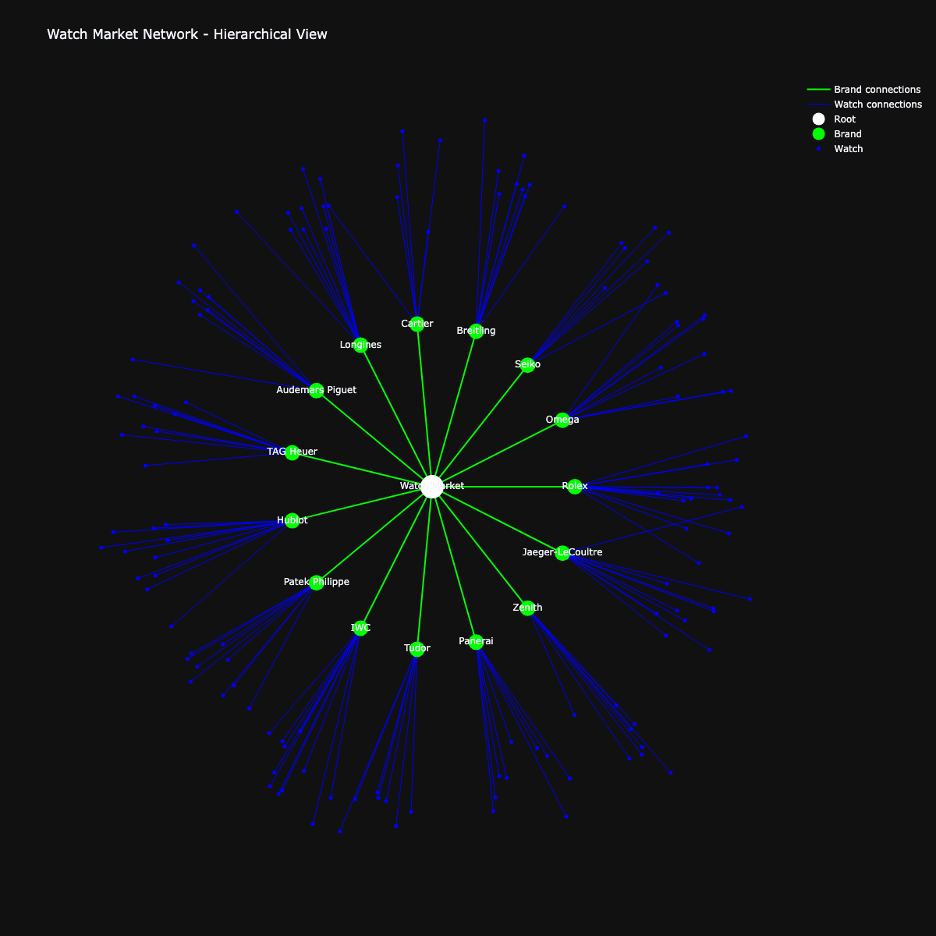
**Starburst Visualization**
|
|
|
|
|
|
|
|
|
|
| 148 |
Radial architecture provides a hierarchical market perspective:
|
| 149 |
+
- Central node represents overall market
|
| 150 |
- Green nodes show brand territories with strategic spacing
|
| 151 |
- Blue peripheral nodes indicate individual timepieces
|
| 152 |
- Node density reveals:
|
|
|
|
| 155 |
- Segment diversification
|
| 156 |
- Balanced spacing between brand nodes indicates market segmentation
|
| 157 |
|
| 158 |
+
[Starburst Graph Image]
|
| 159 |
+
|
| 160 |
|
| 161 |
## Ethics and Limitations
|
| 162 |
|
|
|
|
| 227 |
- Preserve attributions
|
| 228 |
|
| 229 |
|
| 230 |
+
## Technical Details
|
| 231 |
+
|
| 232 |
+
### Power Analysis
|
| 233 |
+
Minimum sample requirements based on statistical analysis:
|
| 234 |
+
- Basic Network: 10,671 nodes (95% confidence, 3% margin)
|
| 235 |
+
- GNN Requirements: 14,400 samples (feature space dimensionality)
|
| 236 |
+
- Brand Coverage: 768 watches per brand
|
| 237 |
+
- Price Segments: 4,320 watches per segment
|
| 238 |
+
|
| 239 |
+
Current dataset (284,491 watches) exceeds requirements with:
|
| 240 |
+
- 5,000+ samples per major brand
|
| 241 |
+
- 50,000+ samples per price segment
|
| 242 |
+
- Sufficient network density
|
| 243 |
+
|
| 244 |
+
### Implementation Details
|
| 245 |
+
|
| 246 |
+
#### Network Architecture
|
| 247 |
+
- 3 GNN layers with residual connections
|
| 248 |
+
- 64 hidden channels
|
| 249 |
+
- 20% dropout rate
|
| 250 |
+
- 4 attention heads
|
| 251 |
+
- Learning rate: 0.001
|
| 252 |
+
|
| 253 |
+
#### Embedding Dimensions
|
| 254 |
+
- Brand: 128
|
| 255 |
+
- Material: 64
|
| 256 |
+
- Movement: 64
|
| 257 |
+
- Temporal: 32
|
| 258 |
+
|
| 259 |
+
#### Network Parameters
|
| 260 |
+
- Connections per watch: 3-5
|
| 261 |
+
- Similarity threshold: 70%
|
| 262 |
+
- Batch size: 50 watches
|
| 263 |
+
- Processing window: 1000 watches
|
| 264 |
+
|
| 265 |
+
#### Condition Scoring
|
| 266 |
+
- New: 1.0
|
| 267 |
+
- Unworn: 0.95
|
| 268 |
+
- Very Good: 0.8
|
| 269 |
+
- Good: 0.7
|
| 270 |
+
- Fair: 0.5
|
| 271 |
+
|
| 272 |
## Usage
|
| 273 |
|
| 274 |
### Required Files
|
dataset_infos.json
DELETED
|
@@ -1,18 +0,0 @@
|
|
| 1 |
-
{
|
| 2 |
-
"default": {
|
| 3 |
-
"description": "Watch Market GNN Dataset",
|
| 4 |
-
"homepage": "https://huggingface.co/datasets/TMVishnu/watch-market-gnn",
|
| 5 |
-
"license": "apache-2.0",
|
| 6 |
-
"features": {
|
| 7 |
-
"watch_gnn_data": "torch_geometric",
|
| 8 |
-
"edges": "numpy",
|
| 9 |
-
"features": "numpy"
|
| 10 |
-
},
|
| 11 |
-
"task_templates": [
|
| 12 |
-
{
|
| 13 |
-
"task": "graph-ml",
|
| 14 |
-
"task_categories": ["graph-ml"]
|
| 15 |
-
}
|
| 16 |
-
]
|
| 17 |
-
}
|
| 18 |
-
}
|
|
|
|
|
|
|
|
|
|
|
|
|
|
|
|
|
|
|
|
|
|
|
|
|
|
|
|
|
|
|
|
|
|
|
|
|
|
|
|
|
|
|
|
|
|
|
|
|
|
|
|
|
|
|
|
|
data/edges.npz → edges.npz
RENAMED
|
File without changes
|
data/features.npy → features.npy
RENAMED
|
File without changes
|
final_embeddings.pt
ADDED
|
@@ -0,0 +1,3 @@
|
|
|
|
|
|
|
|
|
|
|
|
|
| 1 |
+
version https://git-lfs.github.com/spec/v1
|
| 2 |
+
oid sha256:313cc9d898844574164a483e87759df9bb9105d5fd837d2a0f301c0215de417b
|
| 3 |
+
size 291320009
|
loaded_data.pkl
ADDED
|
@@ -0,0 +1,3 @@
|
|
|
|
|
|
|
|
|
|
|
|
|
| 1 |
+
version https://git-lfs.github.com/spec/v1
|
| 2 |
+
oid sha256:b9c0fffa25354d19a3f933a3034eb96c7d49d97bf0aac4739c97951c495d5edf
|
| 3 |
+
size 36141191
|
processed_df.pkl
ADDED
|
@@ -0,0 +1,3 @@
|
|
|
|
|
|
|
|
|
|
|
|
|
| 1 |
+
version https://git-lfs.github.com/spec/v1
|
| 2 |
+
oid sha256:ef91906c5313e76804e010ecbf95bfc960bdf8f72973b7f6ae360913925cf709
|
| 3 |
+
size 615675312
|
data/watch_gnn_data.pt → watch_gnn_data.pt
RENAMED
|
File without changes
|