smolagents documentation
Inspecting runs with OpenTelemetry
Inspecting runs with OpenTelemetry
If you’re new to building agents, make sure to first read the intro to agents and the guided tour of smolagents.
Why log your agent runs?
Agent runs are complicated to debug.
Validating that a run went properly is hard, since agent workflows are unpredictable by design (if they were predictable, you’d just be using good old code).
And inspecting a run is hard as well: multi-step agents tend to quickly fill a console with logs, and most of the errors are just “LLM dumb” kind of errors, from which the LLM auto-corrects in the next step by writing better code or tool calls.
So using instrumentation to record agent runs is necessary in production for later inspection and monitoring!
We’ve adopted the OpenTelemetry standard for instrumenting agent runs.
This means that you can just run some instrumentation code, then run your agents normally, and everything gets logged into your platform. Below are some examples of how to do this with different OpenTelemetry backends.
Here’s how it then looks like on the platform:

Setting up telemetry with Arize AI Phoenix
First install the required packages. Here we install Phoenix by Arize AI because that’s a good solution to collect and inspect the logs, but there are other OpenTelemetry-compatible platforms that you could use for this collection & inspection part.
pip install 'smolagents[telemetry,toolkit]'
Then run the collector in the background.
python -m phoenix.server.main serve
Finally, set up SmolagentsInstrumentor to trace your agents and send the traces to Phoenix default endpoint.
from phoenix.otel import register
from openinference.instrumentation.smolagents import SmolagentsInstrumentor

register()
SmolagentsInstrumentor().instrument()
Then you can run your agents!
from smolagents import (
    CodeAgent,
    ToolCallingAgent,
    WebSearchTool,
    VisitWebpageTool,
    InferenceClientModel,
)

model = InferenceClientModel()

search_agent = ToolCallingAgent(
    tools=[WebSearchTool(), VisitWebpageTool()],
    model=model,
    name="search_agent",
    description="This is an agent that can do web search.",
)

manager_agent = CodeAgent(
    tools=[],
    model=model,
    managed_agents=[search_agent],
)
manager_agent.run(
    "If the US keeps its 2024 growth rate, how many years will it take for the GDP to double?"
)
Voilà!
You can then navigate to http://0.0.0.0:6006/projects/ to inspect your run!

You can see that the CodeAgent called its managed ToolCallingAgent (by the way, the managed agent could have been a CodeAgent as well) to ask it to run the web search for the U.S. 2024 growth rate. Then the managed agent returned its report and the manager agent acted upon it to calculate the economy doubling time! Sweet, isn’t it?
Setting up telemetry with 🪢 Langfuse
This part shows how to monitor and debug your Hugging Face smolagents with Langfuse using the SmolagentsInstrumentor.
What is Langfuse? Langfuse is an open-source platform for LLM engineering. It provides tracing and monitoring capabilities for AI agents, helping developers debug, analyze, and optimize their products. Langfuse integrates with various tools and frameworks via native integrations, OpenTelemetry, and SDKs.
Step 1: Install Dependencies
%pip install langfuse 'smolagents[telemetry]' openinference-instrumentation-smolagentsStep 2: Set Up Environment Variables
Set your Langfuse API keys and configure the OpenTelemetry endpoint to send traces to Langfuse. Get your Langfuse API keys by signing up for Langfuse Cloud or self-hosting Langfuse.
Also, add your Hugging Face token (HF_TOKEN) as an environment variable.
import os
# Get keys for your project from the project settings page: https://cloud.langfuse.com
os.environ["LANGFUSE_PUBLIC_KEY"] = "pk-lf-..."
os.environ["LANGFUSE_SECRET_KEY"] = "sk-lf-..."
os.environ["LANGFUSE_HOST"] = "https://cloud.langfuse.com" # 🇪🇺 EU region
# os.environ["LANGFUSE_HOST"] = "https://us.cloud.langfuse.com" # 🇺🇸 US region

# your Hugging Face token
os.environ["HF_TOKEN"] = "hf_..."
With the environment variables set, we can now initialize the Langfuse client. get_client() initializes the Langfuse client using the credentials provided in the environment variables.
from langfuse import get_client

langfuse = get_client()

# Verify connection
if langfuse.auth_check():
    print("Langfuse client is authenticated and ready!")
else:
    print("Authentication failed. Please check your credentials and host.")
Step 3: Initialize the SmolagentsInstrumentor
Initialize the SmolagentsInstrumentor before your application code.
from openinference.instrumentation.smolagents import SmolagentsInstrumentor

SmolagentsInstrumentor().instrument()
Step 4: Run your smolagent
from smolagents import (
    CodeAgent,
    ToolCallingAgent,
    WebSearchTool,
    VisitWebpageTool,
    InferenceClientModel,
)

model = InferenceClientModel(
    model_id="deepseek-ai/DeepSeek-R1-Distill-Qwen-32B"
)

search_agent = ToolCallingAgent(
    tools=[WebSearchTool(), VisitWebpageTool()],
    model=model,
    name="search_agent",
    description="This is an agent that can do web search.",
)

manager_agent = CodeAgent(
    tools=[],
    model=model,
    managed_agents=[search_agent],
)
manager_agent.run(
    "How can Langfuse be used to monitor and improve the reasoning and decision-making of smolagents when they execute multi-step tasks, like dynamically adjusting a recipe based on user feedback or available ingredients?"
)
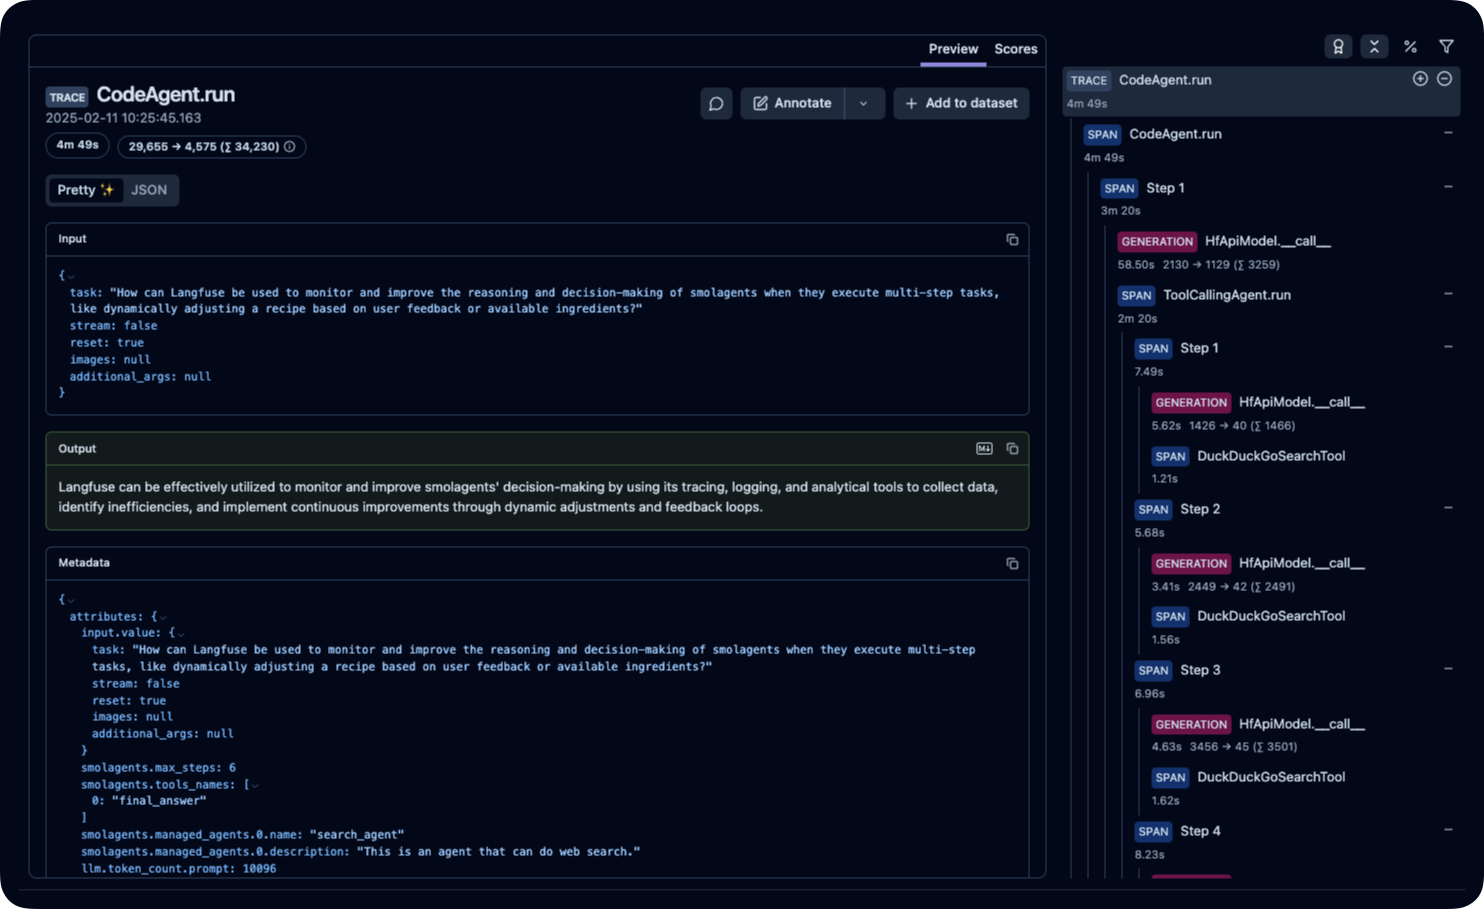
Step 5: View Traces in Langfuse
After running the agent, you can view the traces generated by your smolagents application in Langfuse. You should see detailed steps of the LLM interactions, which can help you debug and optimize your AI agent.

Public example trace in Langfuse
Update on GitHub