
This repository provides weights and evaluation metrics for YOLO models trained on high-resolution satellite imagery for airplane detection using the HRPlanes and CORS-ADD datasets. The analysis covers both direct training and transfer learning with YOLOv8 and YOLOv9 architectures via Ultralytics. Detailed metrics and download links for each model are provided. You can also explore our models on Hugging Face 🤗.
Updates
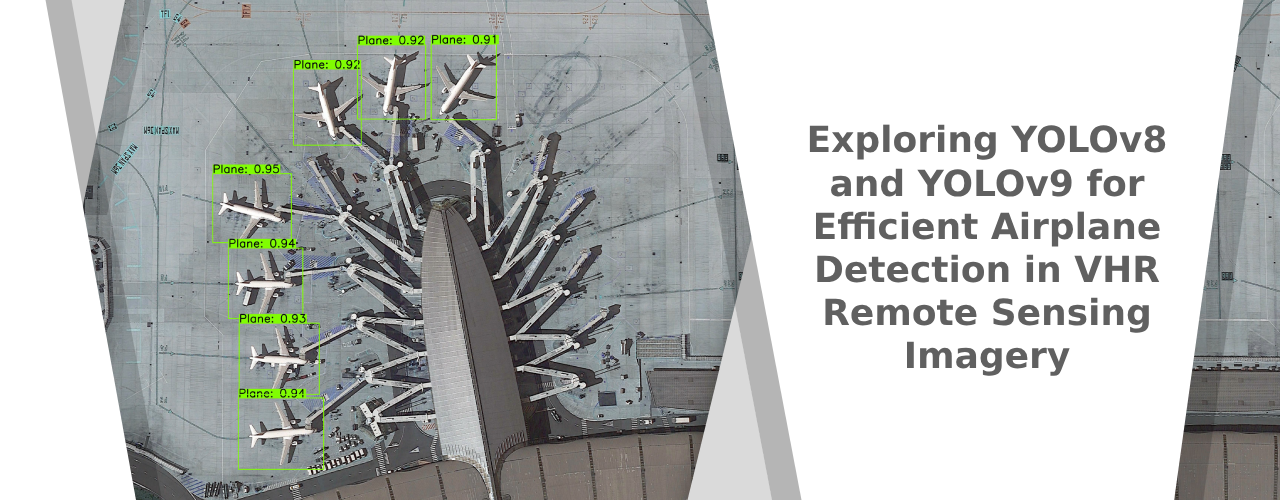
Exploring YOLOv8 and YOLOv9 for Efficient Airplane Detection in VHR Remote Sensing Imagery article is now available!
Explore and utilize these datasets to enhance your deep learning projects for airplane detection.
Latest updates...
October 2024
- Comprehensive inference made on Chicago O'Hare International Airport (ORD/KORD), Amsterdam Schiphol Airport (AMS/EHAM), Beijing Capital International Airport (PEK/ZBAA), and Haneda International Airport (HND/RJTT) airports.
September 2024
- Transfer learning models utilizing CORS-ADD data now included, improving generalization.
June 2024
- Training process complete using YOLOv8 and YOLOv9 architectures.
April 2024
- Pre-process stage complete. The hyperparameters were decided to make experiments.
Datasets
HRPlanes
The HRPlanes dataset consists of high-resolution 4800x2703 RGB images sourced from Google Earth, featuring major airports like Paris-Charles de Gaulle, John F. Kennedy, and airports like Davis-Monthan Air Force Base. A total of 18,477 airplanes were manually annotated with bounding boxes using HyperLabel (now Plainsight), and the annotations were verified by independent analysts.
The dataset is split into:
- 70% (2,170 images) for training
- 20% (620 images) for validation
- 10% (311 images) for testing
The dataset is available in YOLO format on Zenodo.
CORS-ADD Dataset
The CORS-ADD dataset includes 7,337 images from Google Earth and satellites like WorldView-2, WorldView-3, Pleiades, Jilin-1, and IKONOS, with 32,285 aircraft annotations using horizontal and oriented bounding boxes (HBB, OBB). It covers various scenes, from runways to aircraft carriers, featuring aircraft types such as civil planes, bombers, and fighters.
Model performance was evaluated on the CORS-ADD-HBB validation set, showing high precision in aircraft detection. For more details, refer to the original paper: Complex Optical Remote-Sensing Aircraft Detection Dataset and Benchmark.
Experimental Setup
Experiments were run on an NVIDIA A100 40GB SXM GPU with 40GB HBM2 memory, 1,555 GB/s bandwidth, and 19.5 TFLOPS (FP64/FP32). The training environment was set up on Google Colab using CUDA 12.2 for GPU acceleration.
Flowchart

Figure 1. Flowchart of the article.
The flowchart illustrates the structured approach for airplane detection using deep learning models. It includes four key stages:
- Preprocess – Preparation of HRPlanes data and tuning of hyperparameters.
- Train and Evaluate Models – Training and comparison of YOLOv8 and YOLOv9 models.
- Transfer Learning – Testing top models on the CORS-ADD dataset for generalization.
- Comprehensive Inference – Validating models on real-world satellite images for practical reliability.
1. Preprocess
In this phase, we organized the dataset for YOLO-based airplane detection into train, validation, and test sets, each containing images (.jpg) and annotations (.txt). Data was split using predefined lists (train.txt, validation.txt, test.txt). A histogram analyzed bounding box distribution to identify density variations and annotation issues. Finally, the pre-processed data was validated and stored in Google Drive for training readiness.
2. Training
YOLOv8 Models
The YOLOv8 models were trained and evaluated on the HRPlanes dataset with three variants: YOLOv8x, YOLOv8l, and YOLOv8s. Training was done for 100 epochs with a learning rate of 0.001 and batch size of 16, across 36 experiments. We tested different optimizers (SGD, Adam, AdamW), image resolutions (640x640 and 960x960), and augmentation techniques (e.g., hue, saturation, mosaic). Models with 960x960 resolution outperformed smaller ones, achieving mAP50-95 scores above 0.898, with AdamW performing best for the larger variants, delivering top results in mAP, precision, and recall. The top six models, based on mAP and F1 scores, are available for further research.
Table 1. Table of Top 6 YOLOv8 Models Result.
| Experiment ID | Model | Hyperparameters | F1 Score | Precision | Recall | mAP50 | mAP50-95 | Weights |
|---|---|---|---|---|---|---|---|---|
| 12 | YOLOv8x | Network size: 960x960 with Augmentation Optimizer: SGD |
0.9932 | 0.9915 | 0.9950 | 0.9939 | 0.8990 | Download |
| 32 | YOLOv8l | Network size: 960x960 with Augmentation Optimizer: AdamW |
0.9930 | 0.9927 | 0.9933 | 0.9936 | 0.9025 | Download |
| 30 | YOLOv8l | Network size: 960x960 with Augmentation Optimizer: SGD |
0.9922 | 0.9903 | 0.9940 | 0.9941 | 0.9021 | Download |
| 28 | YOLOv8l | Network size: 960x960 with Augmentation Optimizer: Adam |
0.9921 | 0.9915 | 0.9928 | 0.9940 | 0.9018 | Download |
| 14 | YOLOv8x | Network size: 960x960 with Augmentation Optimizer: AdamW |
0.9920 | 0.9915 | 0.9924 | 0.9938 | 0.9020 | Download |
| 50 | YOLOv8s | Network size: 960x960 with Augmentation Optimizer: AdamW |
0.9918 | 0.9934 | 0.9903 | 0.9940 | 0.8983 | Download |
Note: Augmentation parameters include Hue (0.015), Saturation (0.7), Value (0.4), and Mosaic (1). For experiments without augmentation, all parameters are set to 0.
YOLOv9e Models
The YOLOv9e architecture was tested alongside YOLOv8, using a 640x640 resolution for a fair comparison. Models were trained for 100 epochs under the same conditions (learning rate = 0.001, batch size = 16). YOLOv9e models performed competitively, with SGD and augmentation yielding the highest F1 scores, precision, and recall. Incorporating augmentation improved performance slightly, suggesting better generalization.
Table 2. Comparison of YOLOv9e Models Result.
| Experiment ID | Hyperparameters | F1 Score | Precision | Recall | mAP50 | mAP50-95 | Weights |
|---|---|---|---|---|---|---|---|
| 57 | Network size: 640x640 without Augmentation Optimizer: SGD |
0.9899 | 0.9912 | 0.9886 | 0.9935 | 0.8982 | Download |
| 58 | Network size: 640x640 with Augmentation Optimizer: SGD |
0.9917 | 0.9918 | 0.9916 | 0.9937 | 0.8989 | Download |
| 59 | Network size: 640x640 without Augmentation Optimizer: Adam |
0.9882 | 0.9864 | 0.9900 | 0.9930 | 0.8954 | Download |
| 60 | Network size: 640x640 with Augmentation Optimizer: Adam |
0.9889 | 0.9885 | 0.9894 | 0.9934 | 0.8886 | Download |
| 61 | Network size: 640x640 without Augmentation Optimizer: AdamW |
0.9880 | 0.9864 | 0.9896 | 0.9930 | 0.8954 | Download |
| 62 | Network size: 640x640 with Augmentation Optimizer: AdamW |
0.9899 | 0.9891 | 0.9907 | 0.9936 | 0.8930 | Download |
This figure illustrates the performance of both models across various aircraft types and challenging conditions. YOLOv8x predictions closely align with ground truth, exhibiting high precision with fewer false positives and negatives. The YOLOv9e predictions are also effective but show subtle differences in bounding box placement, particularly in edge cases. This highlights the generalization capabilities of both models while revealing slight performance differences.
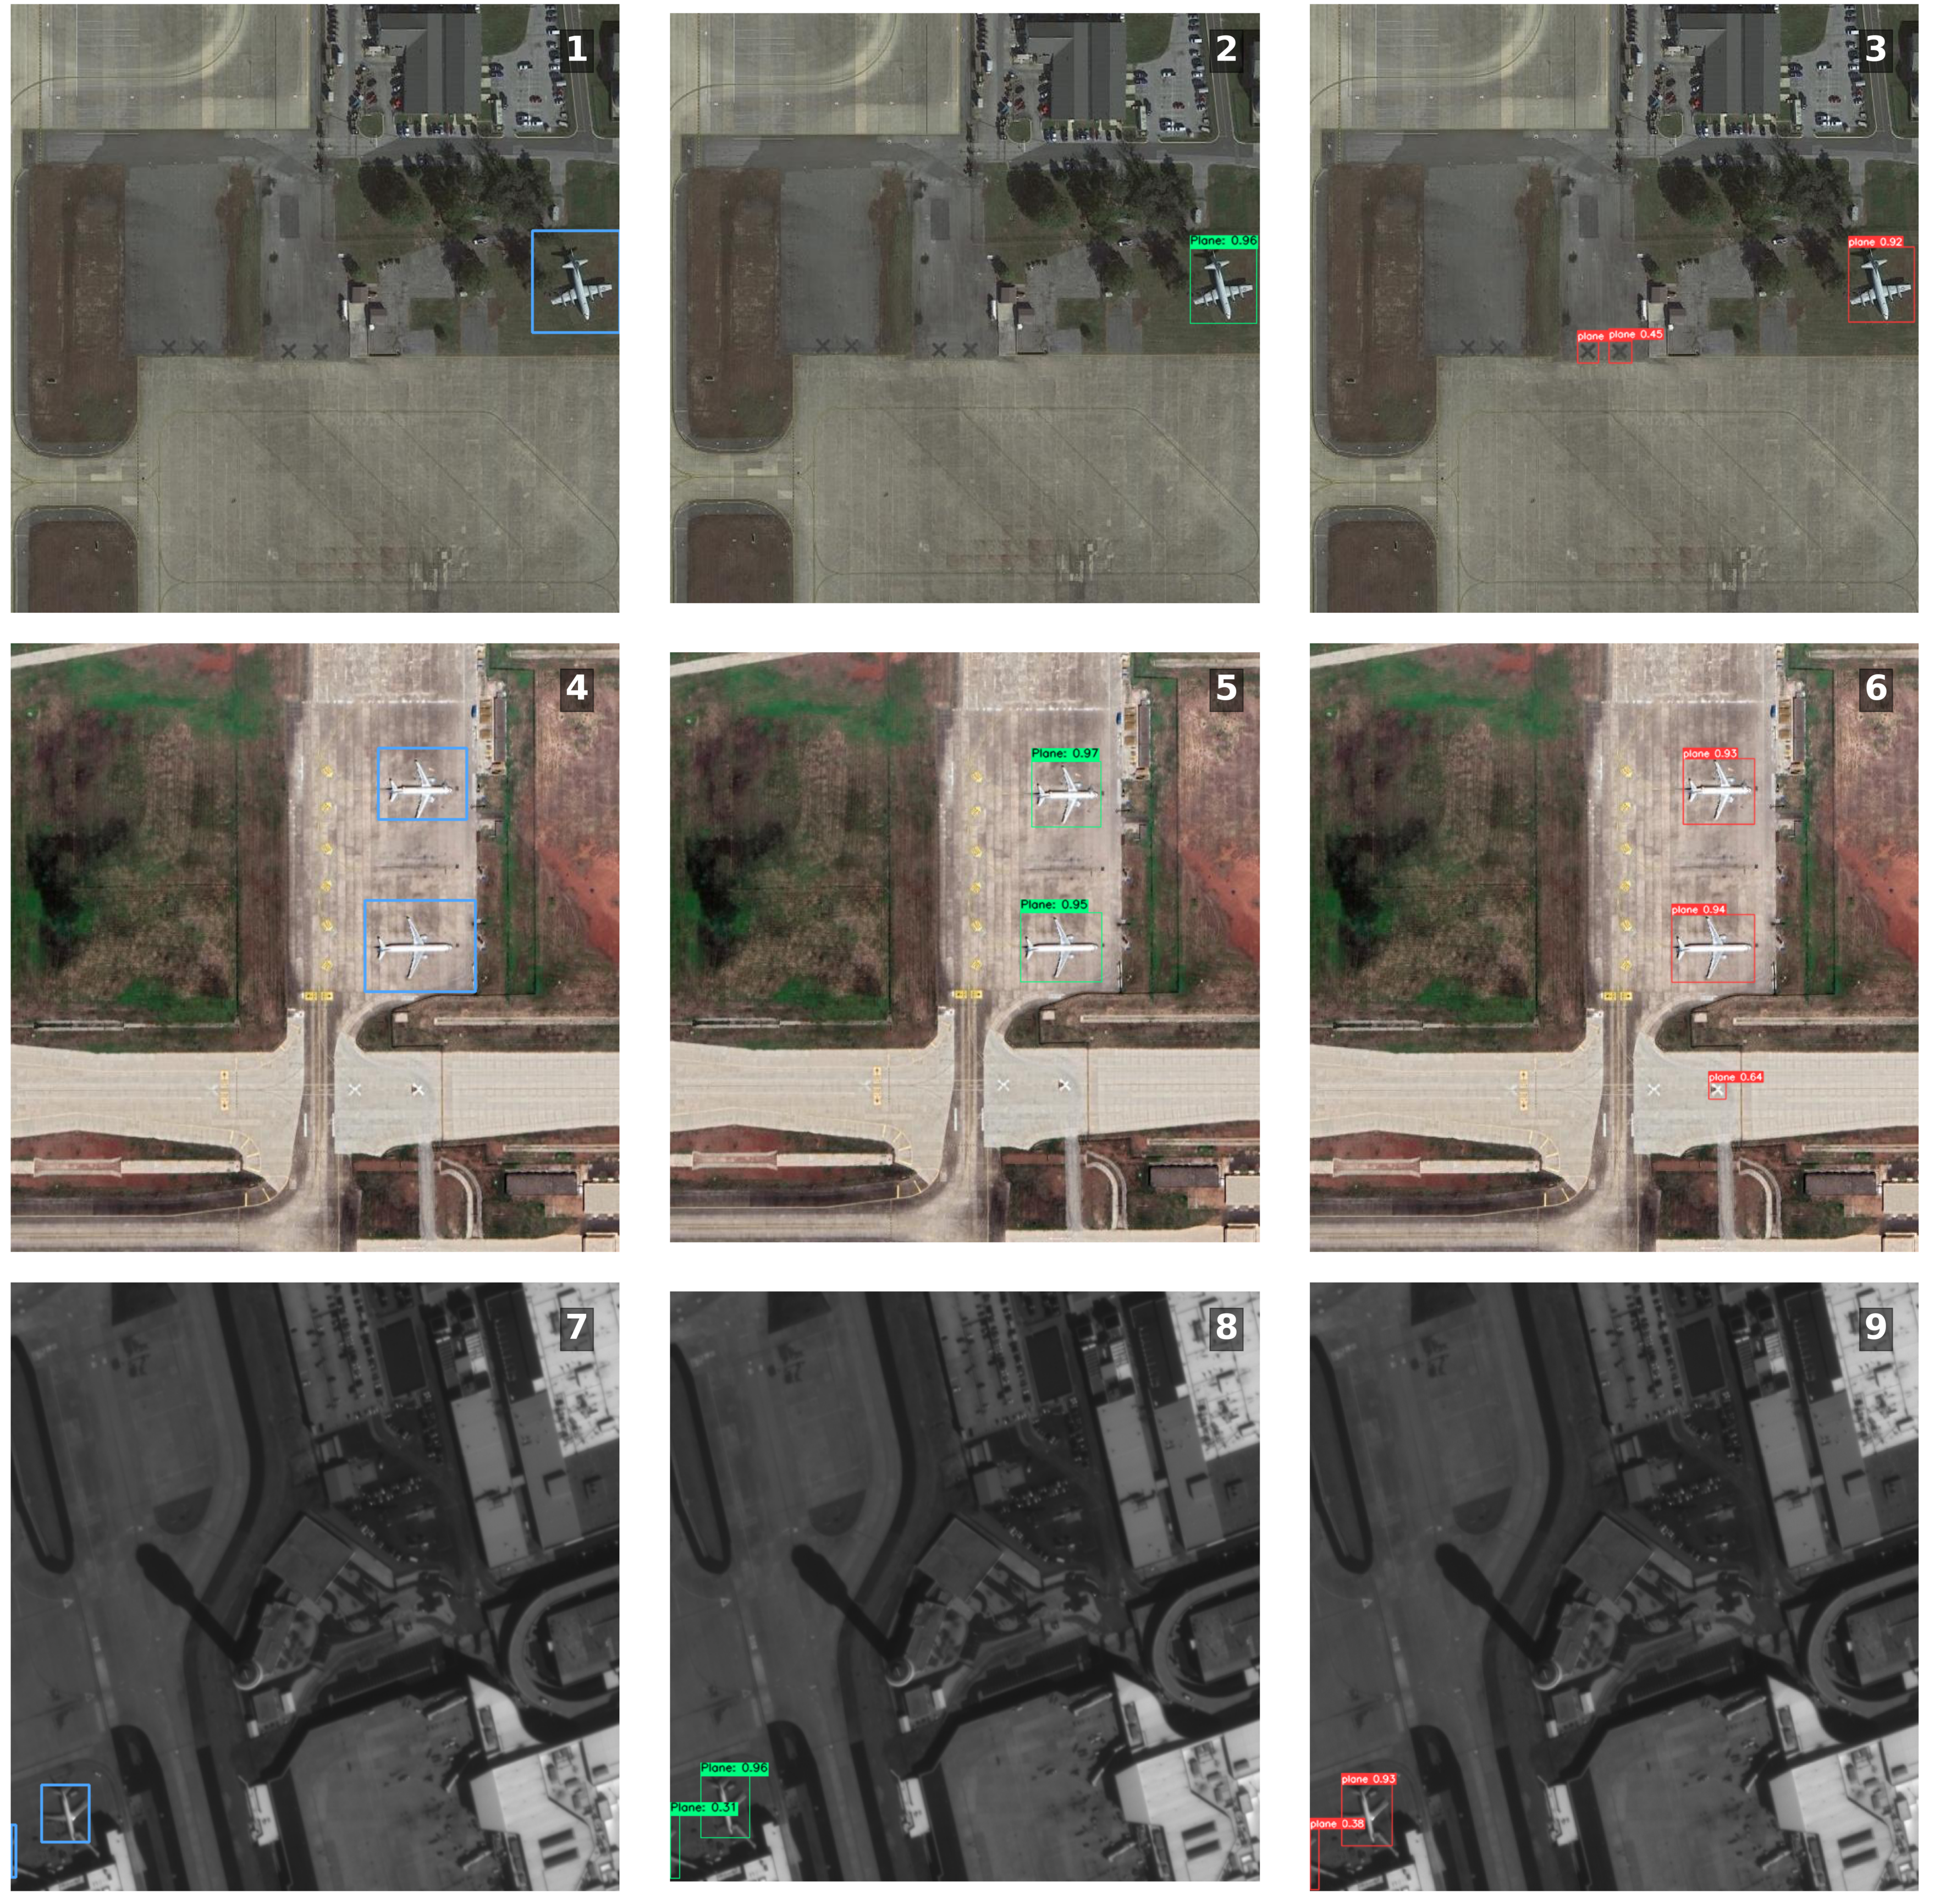
Figure 2. HRPlanes and CORS-ADD dataset samples.
Access to the Details
For those interested in a deeper analysis, all experimental configurations, results, and detailed performance metrics have been documented and made available through a comprehensive spreadsheet of experiment results. This document contains all the specifics of the experiments conducted, including model hyperparameters, optimizer settings, and corresponding performance metrics, offering full transparency into the experimental process.
3. Transfer Learning Using CORS-ADD Dataset
This section explores transfer learning to enhance the generalization of our models for aircraft detection on the CORS-ADD dataset. By fine-tuning pre-trained models from the HRPlanes dataset, we aimed to adapt them to the unique characteristics and challenges of CORS-ADD.
Methodology
We selected the top three models from previous experiments and fine-tuned them for 20 epochs on the CORS-ADD training set. This allowed the models to retain features learned from HRPlanes while adapting to CORS-ADD’s distinct characteristics. Model performance was evaluated on the CORS-ADD validation set, using metrics like F1 score, precision, recall, mAP50, and mAP50-95.
Results
Table 3. Performance Results of Top 3 YOLOv8 Models on the CORS-ADD Dataset Using Transfer Learning
| Experiment ID | Model | Hyperparameters | F1 Score | Precision | Recall | mAP50 | mAP50-95 | Weights |
|---|---|---|---|---|---|---|---|---|
| 12 | YOLOv8x | Network size: 640x640 with Augmentation Optimizer: SGD |
0.9333 | 0.9579 | 0.9100 | 0.9503 | 0.5931 | Download |
| 32 | YOLOv8l | Network size: 640x640 with Augmentation Optimizer: AdamW |
0.9250 | 0.9499 | 0.9013 | 0.9425 | 0.5678 | Download |
| 30 | YOLOv8l | Network size: 640x640 with Augmentation Optimizer: SGD |
0.9352 | 0.9586 | 0.9130 | 0.9505 | 0.5824 | Download |
Table 4. Performance Results of Top 3 YOLOv9e Models on the CORS-ADD Dataset Using Transfer Learning
| Experiment ID | Model | Hyperparameters | F1 Score | Precision | Recall | mAP50 | mAP50-95 | Weights |
|---|---|---|---|---|---|---|---|---|
| 58 | YOLOv9e | Network size: 640x640 with Augmentation Optimizer: SGD |
0.9392 | 0.9560 | 0.9230 | 0.9526 | 0.5942 | Download |
| 57 | YOLOv9e | Network size: 640x640 without Augmentation Optimizer: SGD |
0.9304 | 0.9494 | 0.9121 | 0.9471 | 0.5773 | Download |
| 62 | YOLOv9e | Network size: 640x640 with Augmentation Optimizer: AdamW |
0.9088 | 0.9452 | 0.8751 | 0.9255 | 0.5239 | Download |
Transfer learning significantly boosted performance across all metrics. For example, the YOLOv8x model saw an 11.3% increase in F1 score (from 0.8167 to 0.9333), along with gains in precision (+6.0%), recall (+22.1%), and mAP50 (+12.6%). Similarly, the YOLOv9e model with SGD optimizer and data augmentation showed a 15.0% improvement in F1 score, and increases in precision (+5.4%) and recall (+24.3%).
4. Comprehensive Inference for Large Input Images
This section presents a thorough evaluation of the performance of a deep learning-based airplane detection model using Very High Resolution (VHR) satellite imagery from four major international airports: Chicago O'Hare International Airport (ORD/KORD), Amsterdam Schiphol Airport (AMS/EHAM), Beijing Capital International Airport (PEK/ZBAA), and Haneda International Airport (HND/RJTT). These airports were selected based on their high air traffic volume, availability of high-resolution imagery, and diversity in geographical and operational conditions. This ensures a comprehensive analysis of the model's performance across varied environments and operational scenarios.
Methodology
The study used VHR satellite imagery with a spatial resolution of 0.31m sourced from Google Satellites. To assess the model’s ability to perform at different scales, each airport image was segmented into three levels:
- Level 1: One large image covering the entire airport.
- Level 2: Four sections that divide the original image.
- Level 3: Sixteen smaller sections for more granular analysis.
The YOLOv8x model, previously trained on the HRPlanes dataset, was utilized for the inference process. The model was tested with input sizes of 640x640 and 960x960 pixels to evaluate how varying image resolutions impacted detection accuracy. Key performance metrics such as precision, recall, F1 score, and mean average precision (mAP) were recorded at both mAP50 and mAP50-95 thresholds.
Table 5. Top 6 Results of the Comprehensive Inference
| Exp. No | IATA/ICAO Code | Image Level | Network Size | Number of Airplanes (GT) | Number of Airplanes (Inference) | F1 Score | Precision | Recall | mAP50 | mAP50-95 | Inference Time (as ms) |
|---|---|---|---|---|---|---|---|---|---|---|---|
| 32 | PEK/ZBAA | 2 | 960x960 | 31 | 31 | 0.9992 | 0.9984 | 1 | 0.995 | 0.7854 | 605.2 |
| 34 | PEK/ZBAA | 1 | 1280x1280 | 31 | 30 | 0.9991 | 1 | 0.9982 | 0.995 | 0.7741 | 307.0 |
| 25 | AMS/EHAM | 1 | 1280x1280 | 74 | 74 | 0.9931 | 0.9862 | 1 | 0.9947 | 0.8303 | 300.1 |
| 6 | ORD/KORD | 3 | 960x960 | 131 | 126 | 0.9876 | 1 | 0.9754 | 0.9911 | 0.8044 | 2096.0 |
| 13 | HND/RJTT | 1 | 960x960 | 61 | 60 | 0.9899 | 0.9963 | 0.9836 | 0.9944 | 0.7617 | 202.0 |
| 17 | HND/RJTT | 2 | 1280x1280 | 64 | 61 | 0.9837 | 1 | 0.9678 | 0.9833 | 0.8113 | 1036.4 |
Note: Full results are provided for all experiments, capturing the impact of image, resolution, and model input size on airplane detection accuracy.
Figure 3 illustrates the results of airplane detection at Chicago O'Hare International Airport (ORD/KORD) using the YOLOv8x model with a 960x960 pixel network input size. The analysis is performed across three levels of image granularity: Level 1 (a), Level 2 (b), and Level 3 ( c). In Figure 4, we developed a CAM-like heatmap for airplane detection using YOLO-based object tracking. Instead of traditional Class Activation Maps, we created radial gradient masks centered on tracked airplane bounding boxes. These were accumulated over time to generate a spatiotemporal heatmap, which, when blended with original frames, visualizes high-activity zones without requiring access to model internals.

|

|
| Figure 3 — Airplane detection at Chicago O'Hare (ORD) with YOLOv8x using 960×960 input across three image scales (Levels 1–3). | Figure 4 — Zoomed-in heatmap view revealing localized airplane activity with higher spatial clarity across three image scales (Levels 1–3). |
Access to the Details
We conducted 36 experiments to assess the model’s efficacy, varying image resolution, architecture, and network size. Each experiment aimed to identify the best configuration for airplane detection in satellite imagery. For detailed results, please refer to the Experiments Spreadsheet.
Citation
If you use this dataset or the associated model weights in your research or applications, please cite the following publication:
Doğu İlmak, Tolga Bakirman, Elif Sertel
Exploring You Only Look Once v8 and v9 for efficient airplane detection in very high resolution remote sensing imagery
Engineering Applications of Artificial Intelligence, Volume 160, 2025, Article 111854
https://doi.org/10.1016/j.engappai.2025.111854
BibTeX:
@article{ILMAK2025111854,
  title     = {Exploring You Only Look Once v8 and v9 for efficient airplane detection in very high resolution remote sensing imagery},
  journal   = {Engineering Applications of Artificial Intelligence},
  volume    = {160},
  pages     = {111854},
  year      = {2025},
  issn      = {0952-1976},
  doi       = {10.1016/j.engappai.2025.111854},
  url       = {https://www.sciencedirect.com/science/article/pii/S0952197625018561},
  author    = {Doğu İlmak and Tolga Bakirman and Elif Sertel},
  keywords  = {Airplane detection, Deep learning, You Only Look Once, Transfer learning, Optimization}
}